Case · Retention decisions
Which customers are worth the retention investment?
Case details anonymised. Only synthetic data shown.
A subscription business had a blanket goal of "reducing churn." Analysis revealed that retention effort was distributed uniformly across segments with very different value profiles. Some high-churn segments were unprofitable. Some low-churn segments were eroding margin silently.
What changed
Not just predictions, but a decision framework with explicit trade-offs.
enabling targeted intervention
distribution across all segments
whether retention effort is justified
addressable vs. structural
Initial diagnostic
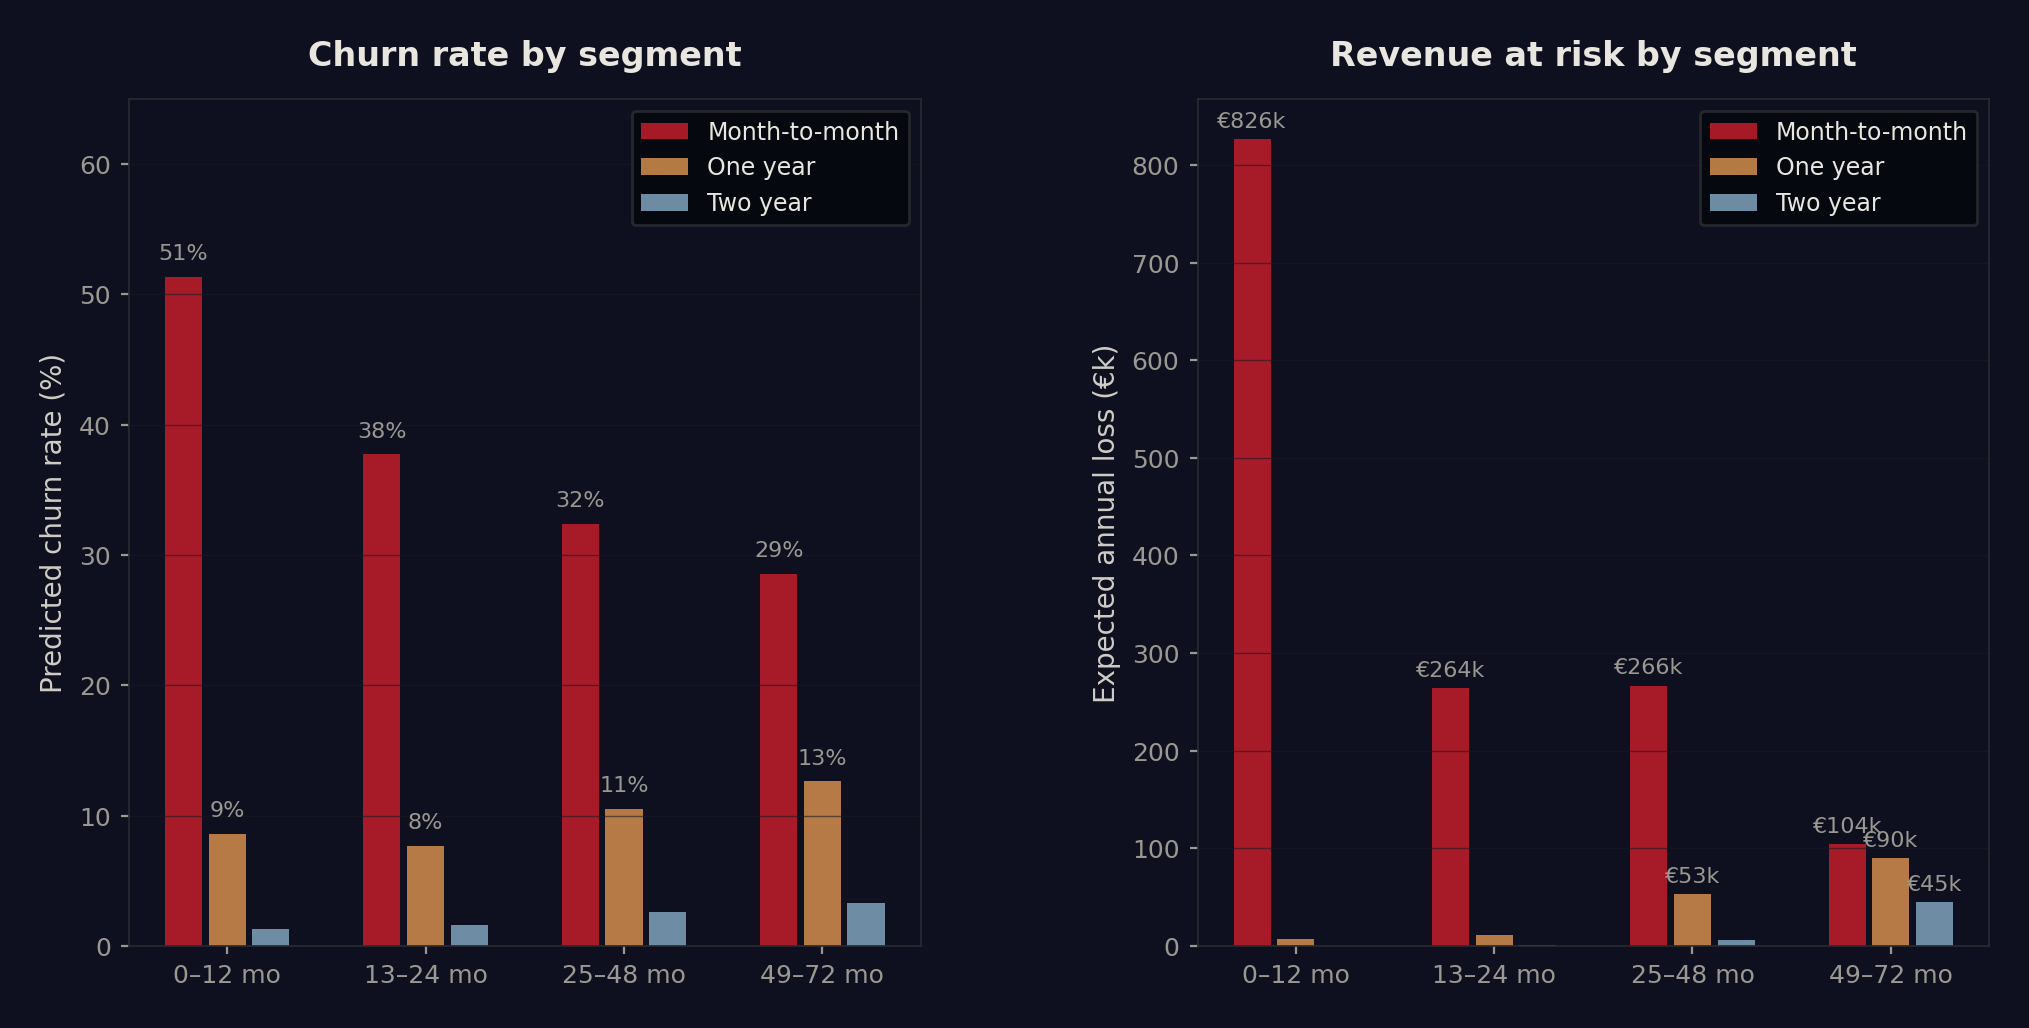
The organisation's retention strategy treated all customers equally. A diagnostic showed that customer segments had fundamentally different value profiles, churn drivers, and cost-to-retain ratios.
Retention spend was distributed uniformly, which meant resources were going to segments where effort had no measurable effect (customers who would stay regardless) and to segments with negative expected value (unprofitable customers).
Findings
- Segment disparity: customer groups with 5x difference in lifetime value were receiving identical retention effort.
- Misallocated spend: a significant share of retention budget was directed at segments where it had no measurable effect.
- Implicit prioritisation: de facto allocation choices were already being made, but without explicit criteria.
Predictive model with explainability
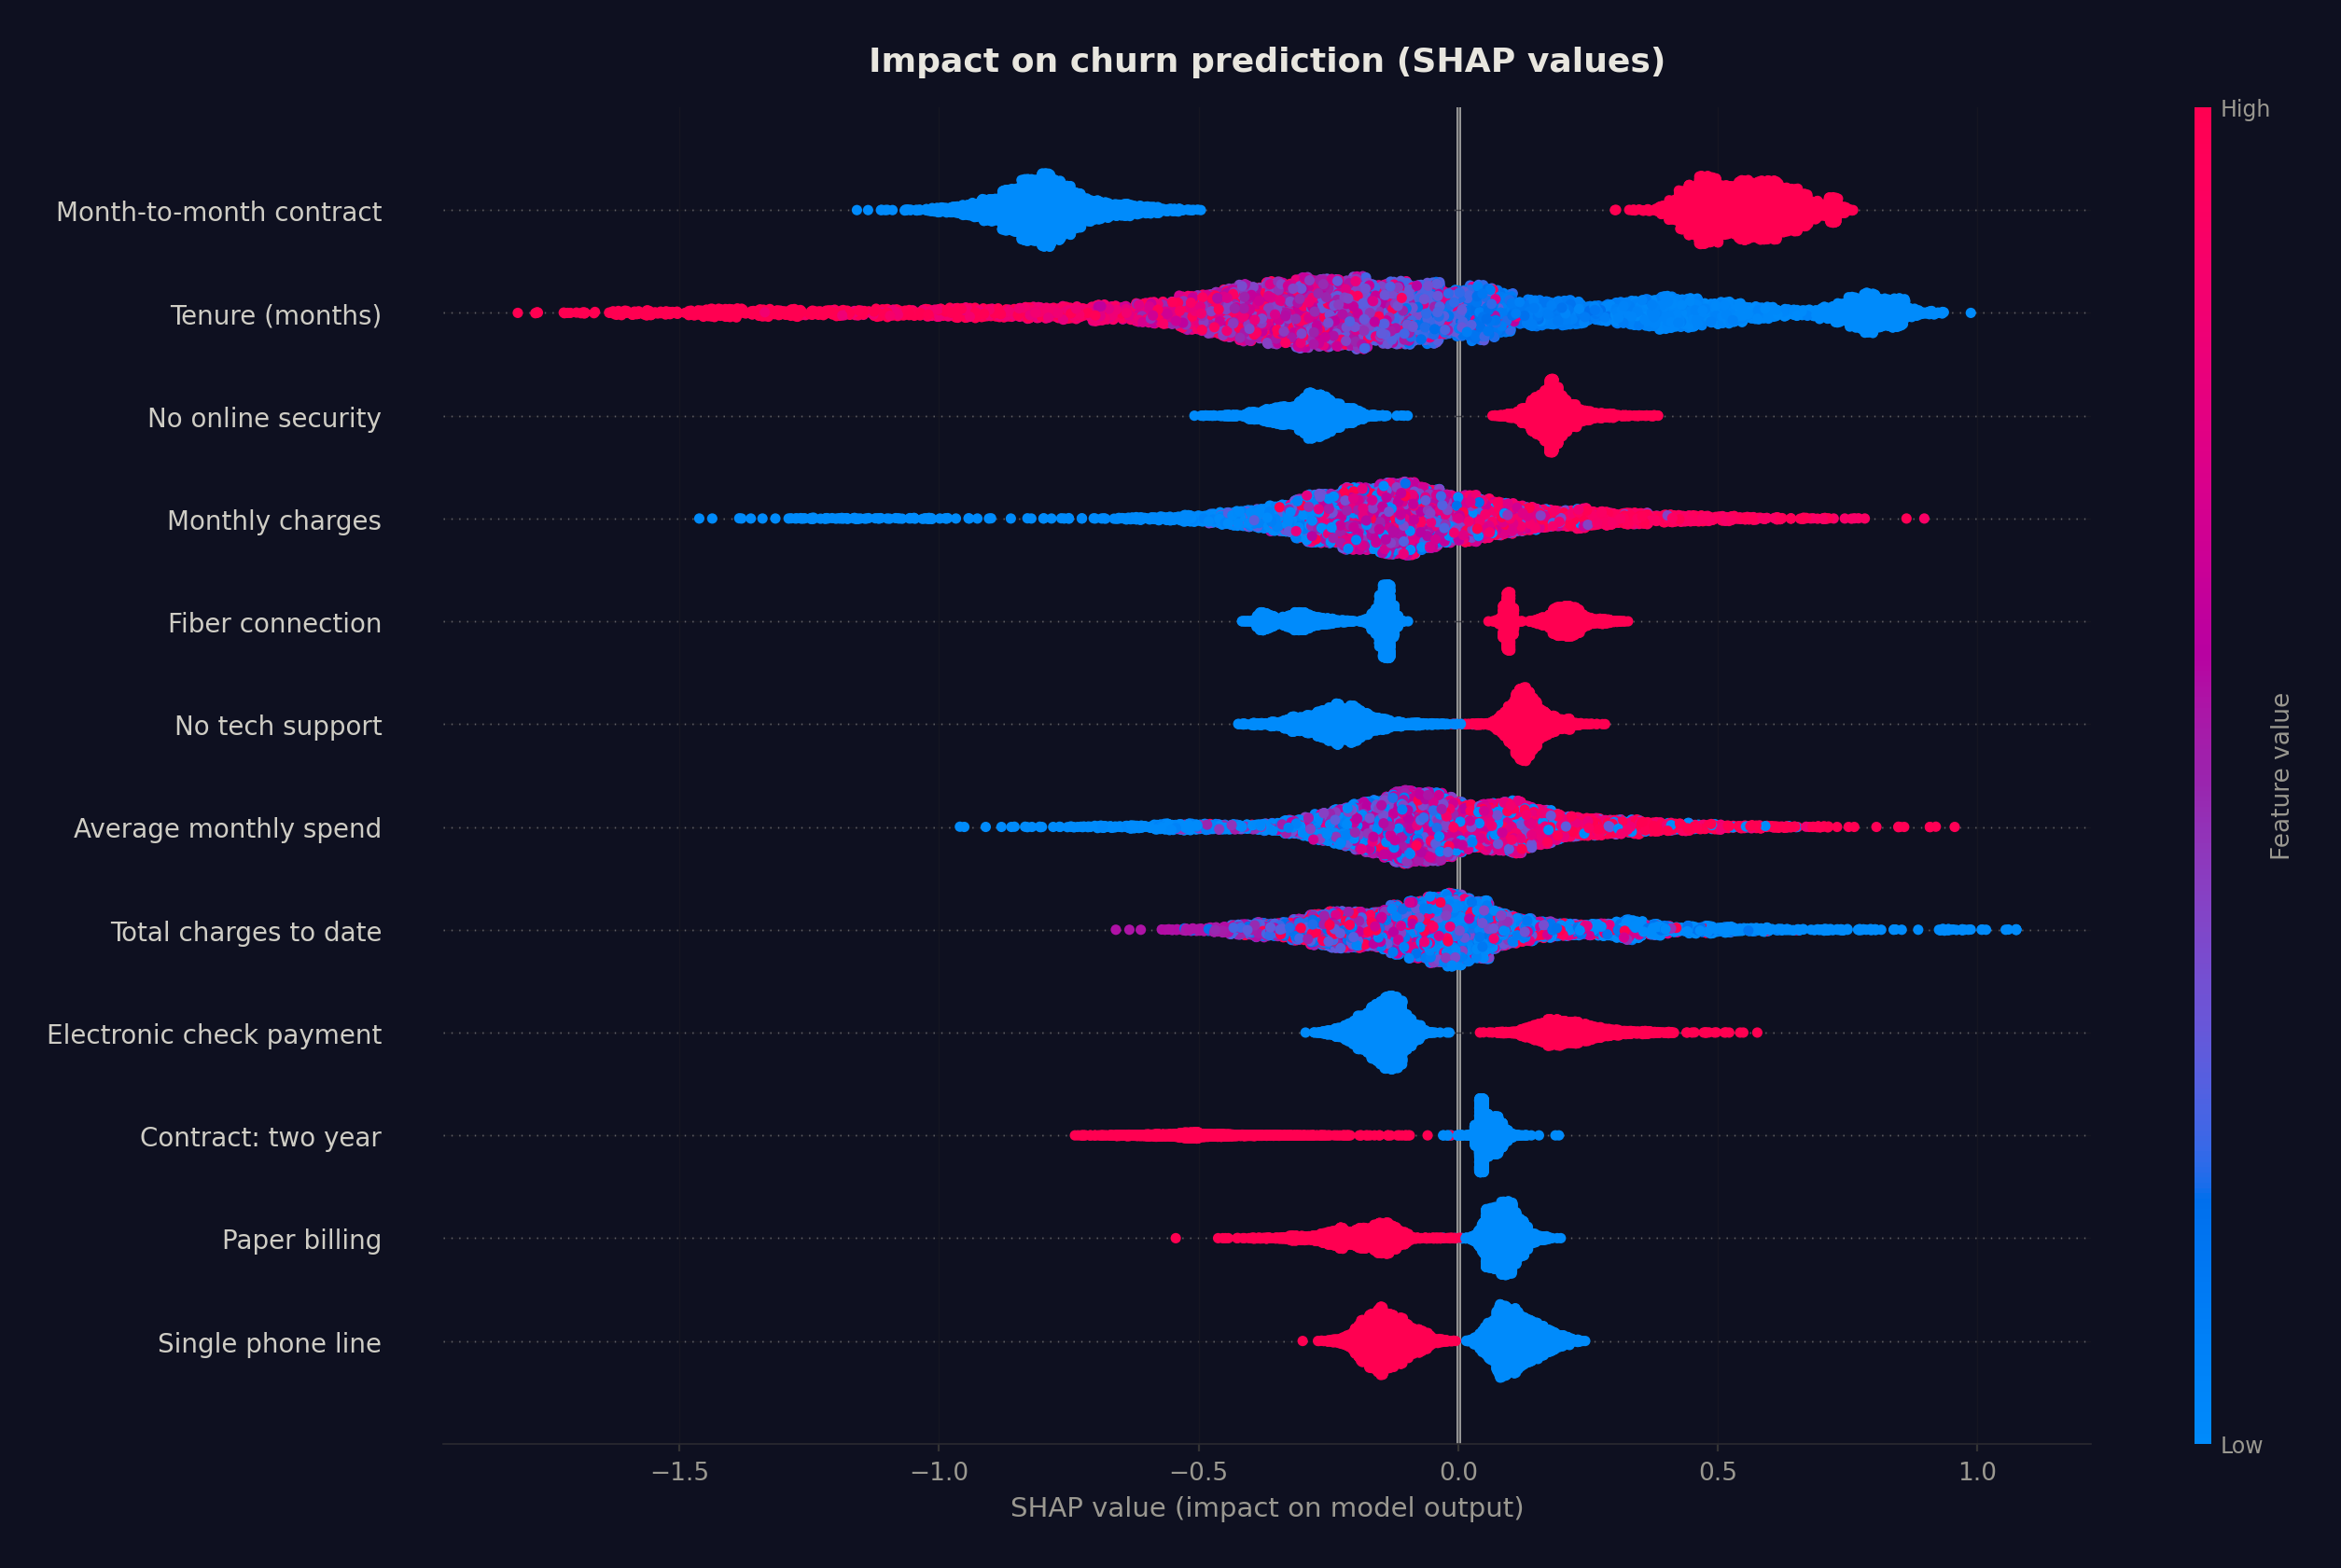
The pilot combined a churn prediction model with an explainability layer (SHAP) that decomposed each prediction into its contributing factors. This separated actionable drivers (service issues, pricing mismatches) from structural ones (product scope decisions, market positioning).
A portion of observed churn traced back to earlier strategic decisions in pricing and service scope. Reducing that churn would require revisiting those decisions, not increasing retention spend.
Outputs
- Investment thresholds: expected value per customer segment determines whether retention effort is cost-effective.
- Driver decomposition: churn causes classified as addressable (operational) or structural (strategic).
- Escalation criteria: conditions under which churn patterns indicate a strategic issue rather than an operational one.
Decision system
The model developed into a system that operates on two levels. At the individual level, it identifies which customers are at risk and whether intervention is cost-effective. At the policy level, it quantifies the effect of structural changes: what happens to churn and margin if pricing changes, service levels shift, or contract terms are adjusted.
A scenario engine tests both types of intervention. For retention budgets, it calculates expected return per segment. For policy changes, it estimates the churn impact across the entire portfolio, separating operational improvements from strategic trade-offs.
Structure
- Individual targeting: per-customer risk scores with expected value of intervention.
- Policy simulation: estimated churn and margin impact of structural changes (pricing, service, scope).
- Driver decomposition: which variables drive churn, ranked by effect size and addressability.
The result is not a churn prediction. It is a framework that quantifies both individual retention decisions and the portfolio-level effects of policy changes.
